Aerial imagery you can actually use.
Every project begins with aerial capture. What we build from those photographs depends on the property and what you need to understand about it - so the deliverables below are a menu, not a fixed package.
Original aerial photographs
The full-resolution photographs captured during the flight, exactly as the camera recorded them.
These are useful on their own - for marketing, for records, for showing someone what a corner of the property looks like. They are also the raw material everything else is built from, so you keep them. If you later want a different output from the same flight, the source data is already yours.
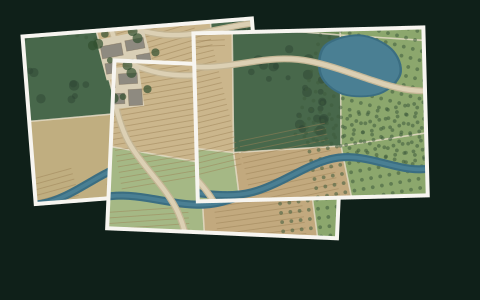
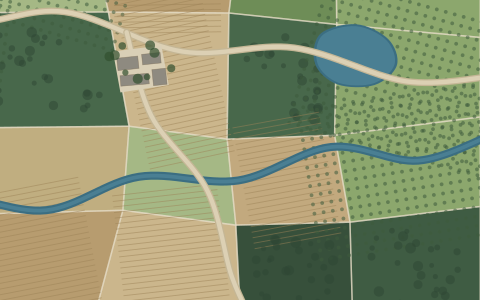
Orthomosaic
Hundreds or thousands of photographs combined into one high-resolution, top-down image of the property.
Unlike an ordinary aerial photograph, an orthomosaic is geometrically corrected: every point is shown as if viewed from directly above, at a consistent scale. That is what makes it behave like a map rather than a picture - you can trace a boundary along it, compare one part of the site to another, and print it at a known scale.
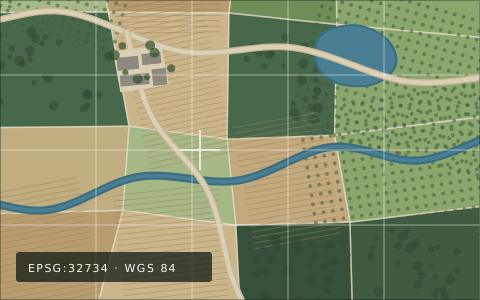
GeoTIFF
The orthomosaic with its real-world position built in, so mapping software knows exactly where on Earth it belongs.
Open a GeoTIFF in GIS or mapping software and it lands in the correct place, at the correct scale, ready to sit underneath or on top of whatever else you already have - cadastral data, farm blocks, a proposed layout. It works in the common desktop GIS packages, including QGIS and ArcGIS.
3D model
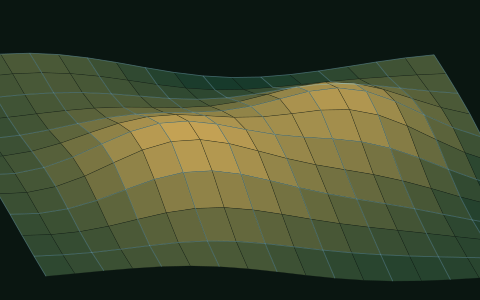
A three-dimensional reconstruction of the terrain, structures and visible features captured during the flight.
Where a map answers where, a model answers how the land sits. Slope, elevation change, how a building relates to the ground it stands on, how a site falls towards a river. It is also the most immediately convincing thing to put in front of someone who has never seen the property.
Point cloud
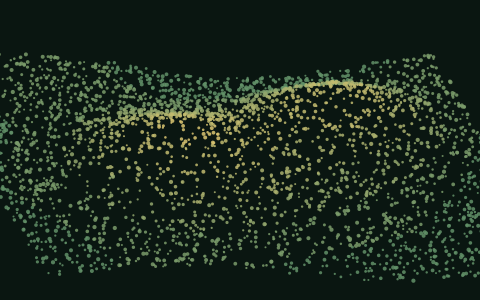
A dense collection of three-dimensional points describing the surface that was captured.
The point cloud is what the 3D surface is built from, and it is the output most likely to be requested by a surveyor, engineer or consultant working alongside you. We provide it where it is useful for the project rather than by default.
And what can be built from those.
Once a site has been reconstructed, other spatial products become possible. Whether they make sense depends on the property, the terrain and what the data is for - so we scope them per project rather than listing them as standard.
If you already know you need one of these, say so in your enquiry. It changes how the flight is planned, and planning for it up front is much better than trying to derive it afterwards.
- Digital elevation models
- Contour generation
- Area and distance measurement
- Volume estimation
- Slope and terrain visualisation
- Before-and-after comparisons
- Annotated site plans
- Inspection imagery of specific features
A note on what these mean. Measurements taken from photogrammetric data are as good as the capture and processing behind them. We will tell you what a given project’s data is designed to support before you commission it - and where a decision needs survey-grade or legally certified numbers, that calls for an appropriately qualified professional. More on accuracy.
Tell us what you need to see.
Describe the property and what you are trying to understand about it. We will come back with how we would capture it, what you would receive, and what it costs.