This is one property, flown once.
Every figure elsewhere on this site now comes from this survey. A smallholding on the Roodefontein road with 16.2 hectares mapped, flown on a single morning in three flights, and reconstructed into the outputs described under what you receive.
The map below is the finished orthomosaic. It is the real thing, not a screenshot: drag it, and zoom until you can read the roof.
Three flights, seventy-one minutes,
945 photographs.
The drone flew a nadir grid over the farmstead and two oblique orbits of the wider property. Nadir frames give the map its geometry; obliques see the sides of buildings and the underside of tree canopy, which is what stops a reconstruction collapsing into a flat sheet.
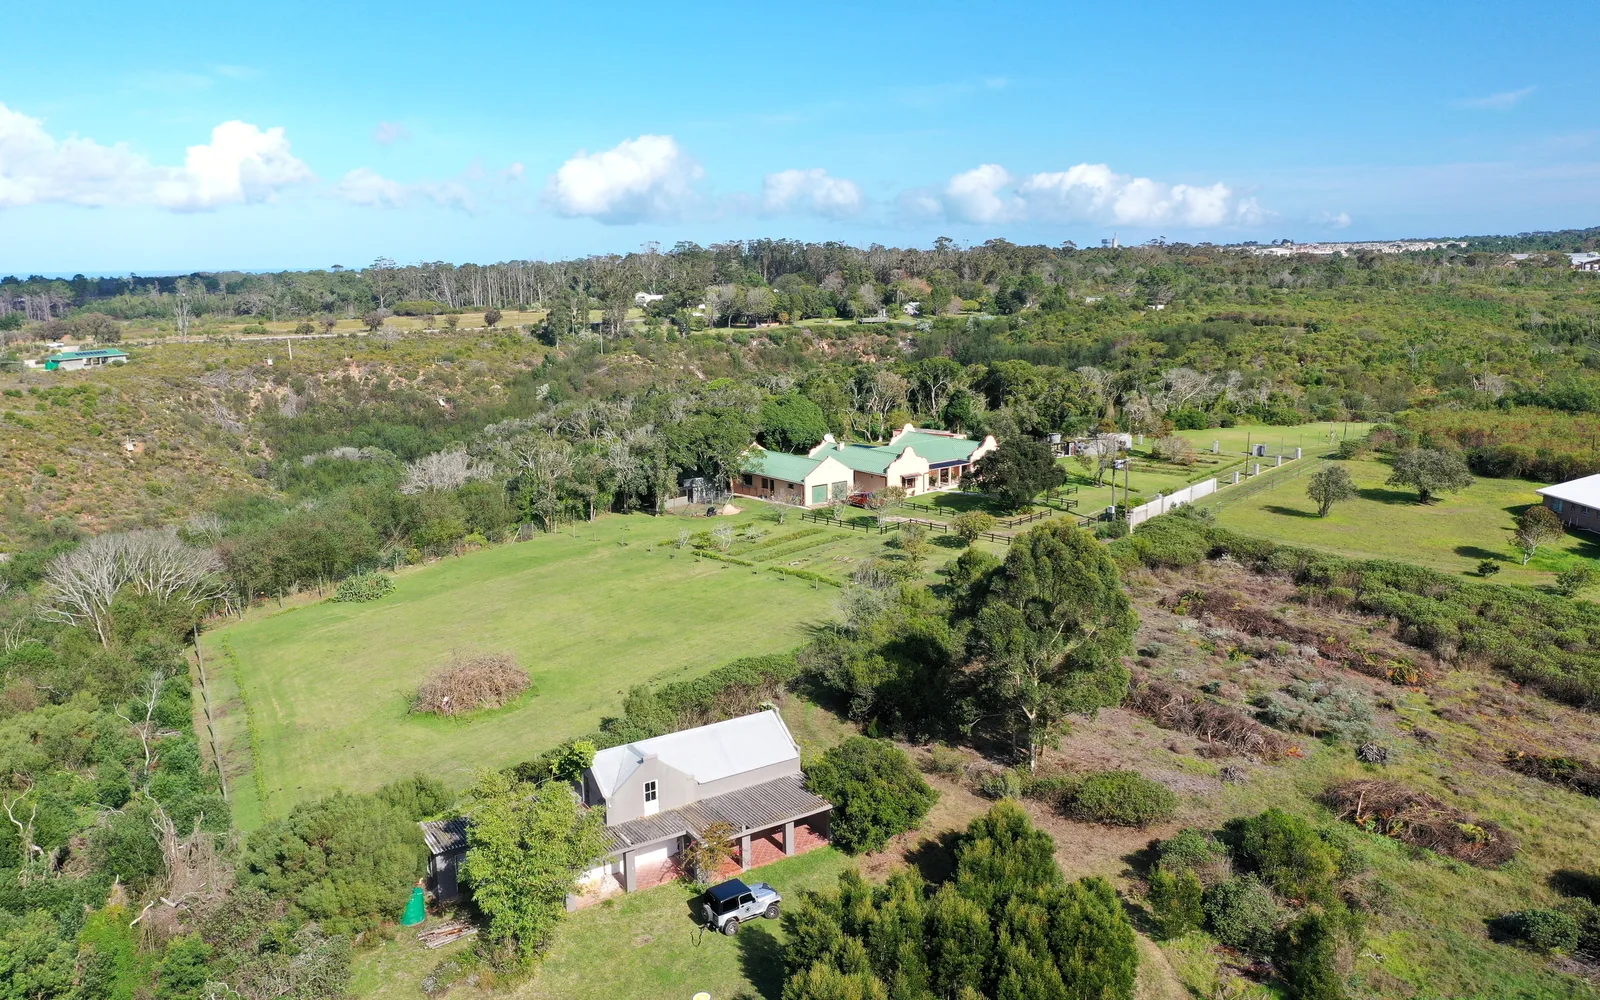
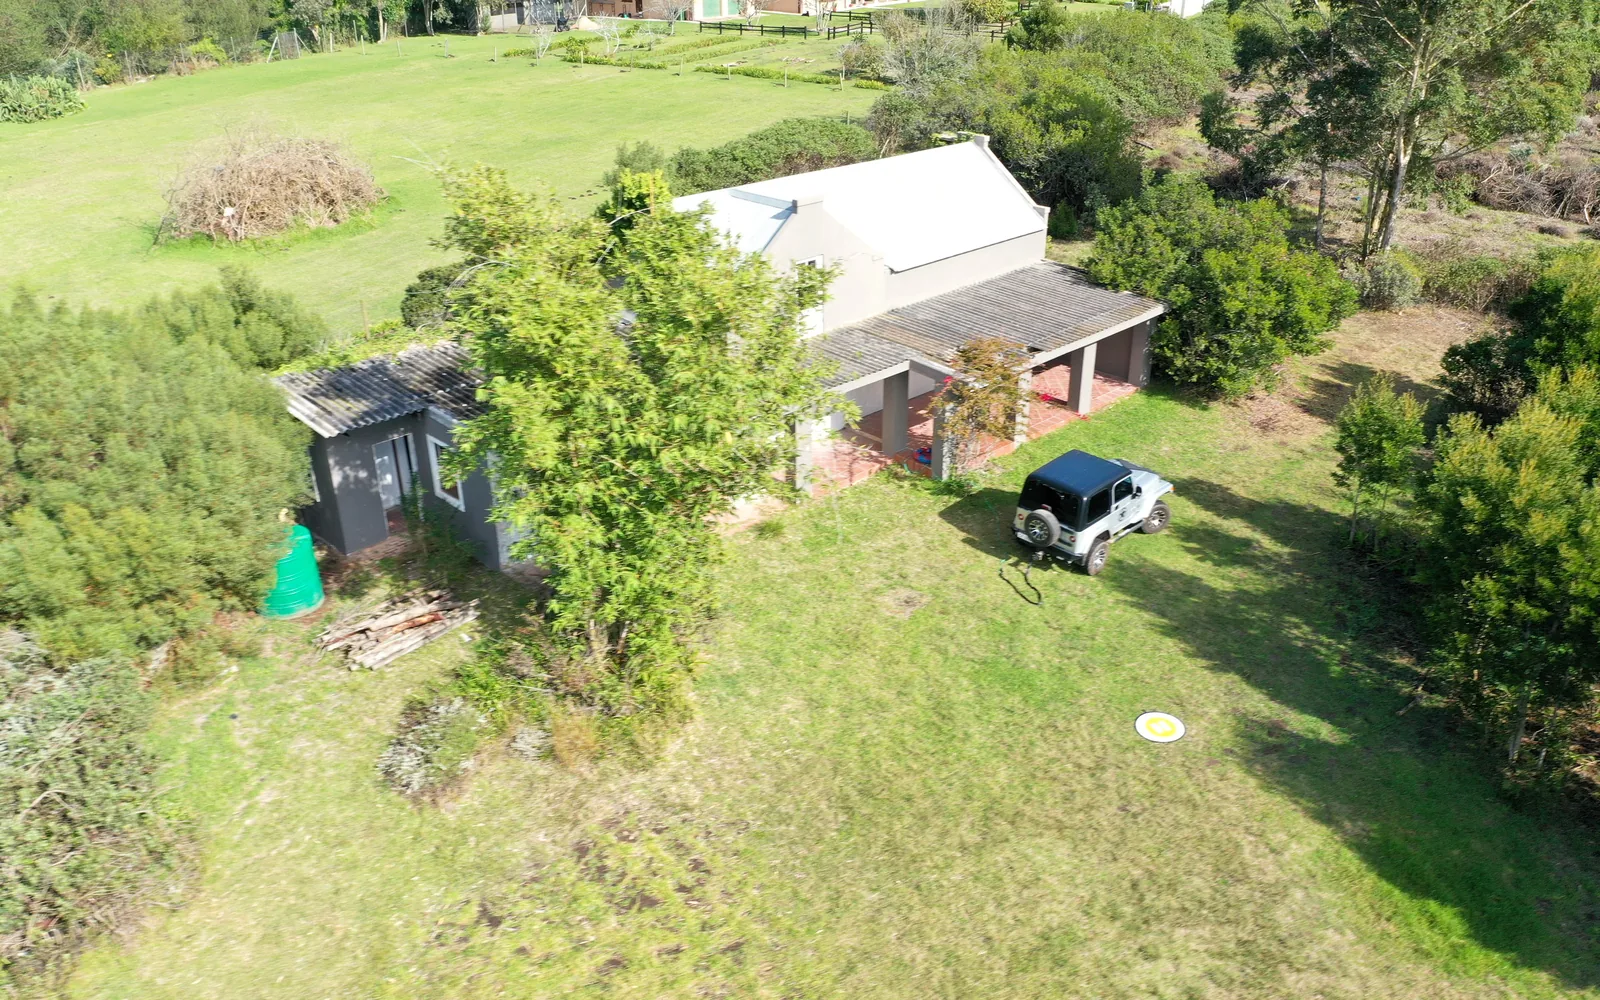
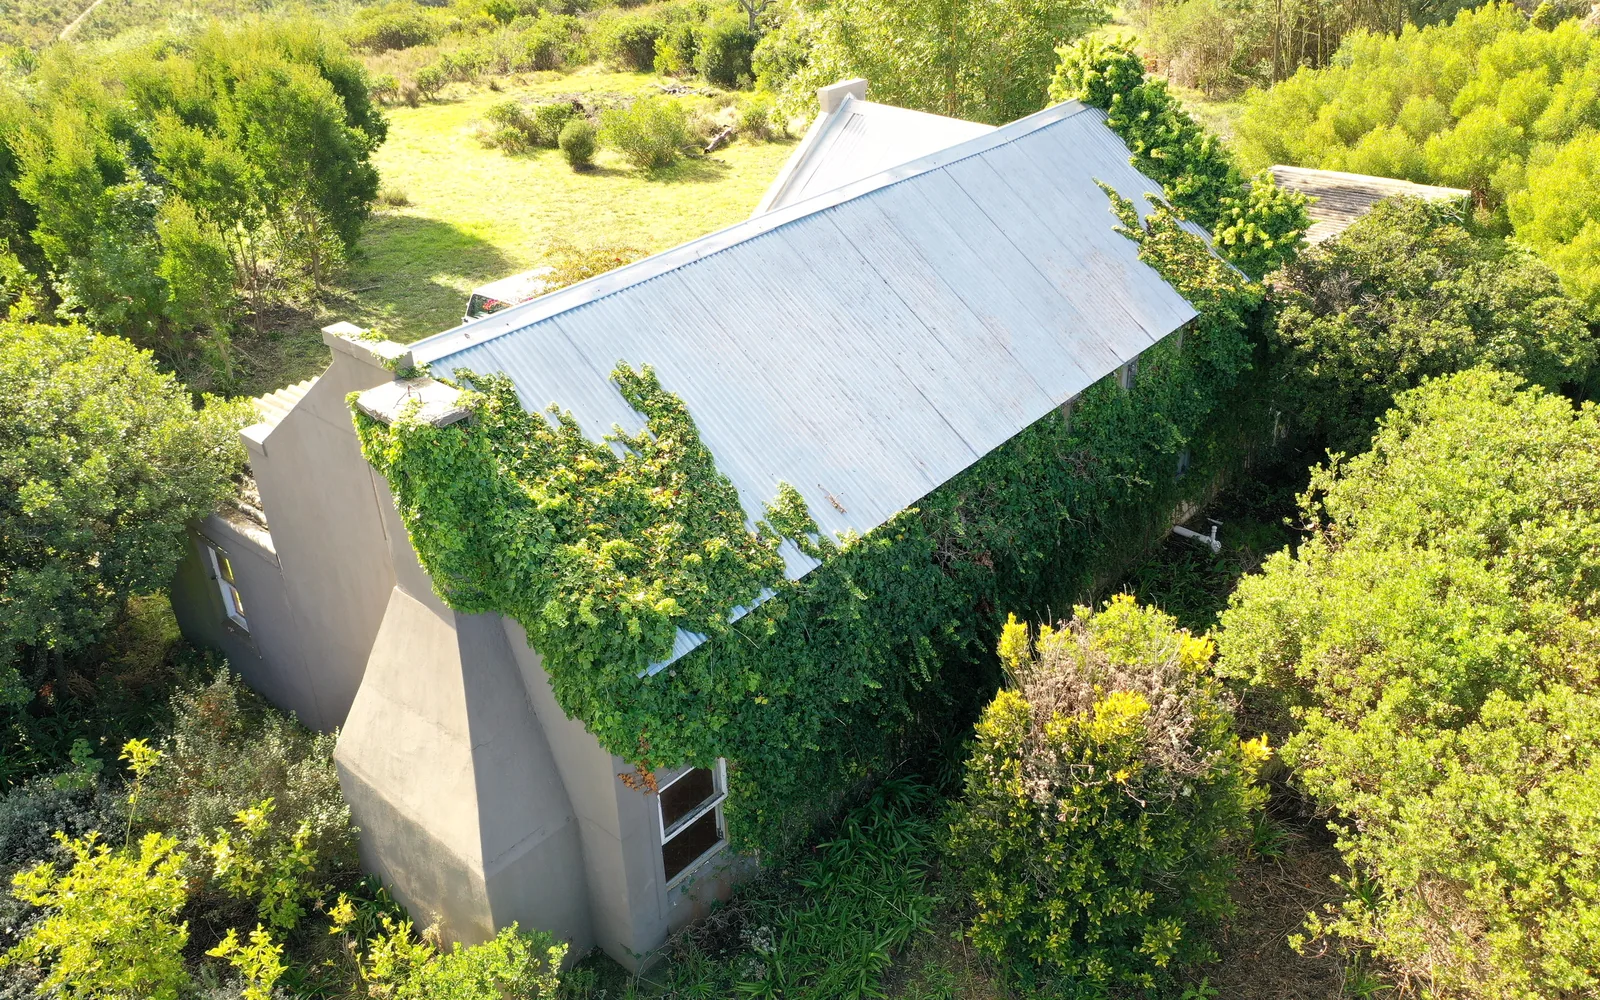
A further 46 frames were flown low and close to the buildings. Those are photographs rather than survey data, and they were deliberately left out of the reconstruction: a frame shot from six metres up pointing almost level sees a wall and a lot of sky, and sky has nothing in it to match. Three of them are at the bottom of this page.
Every output on this site, from this one flight.
These are the actual deliverables, reduced for the page. Nothing here is a diagram of what the output would look like.
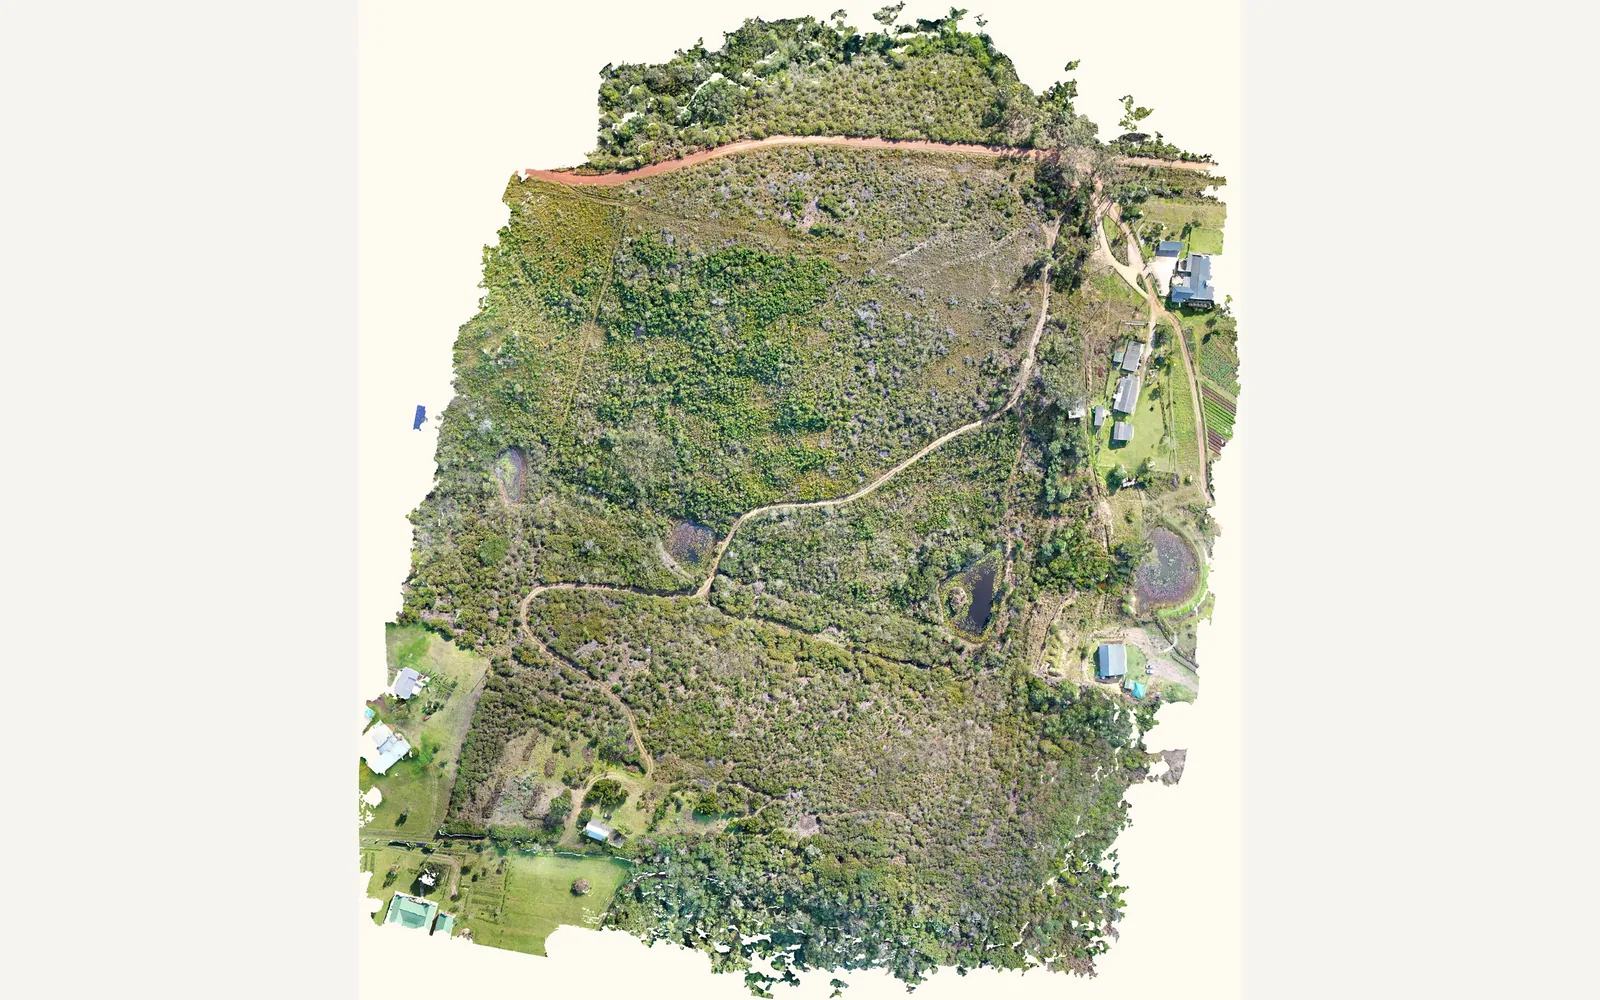
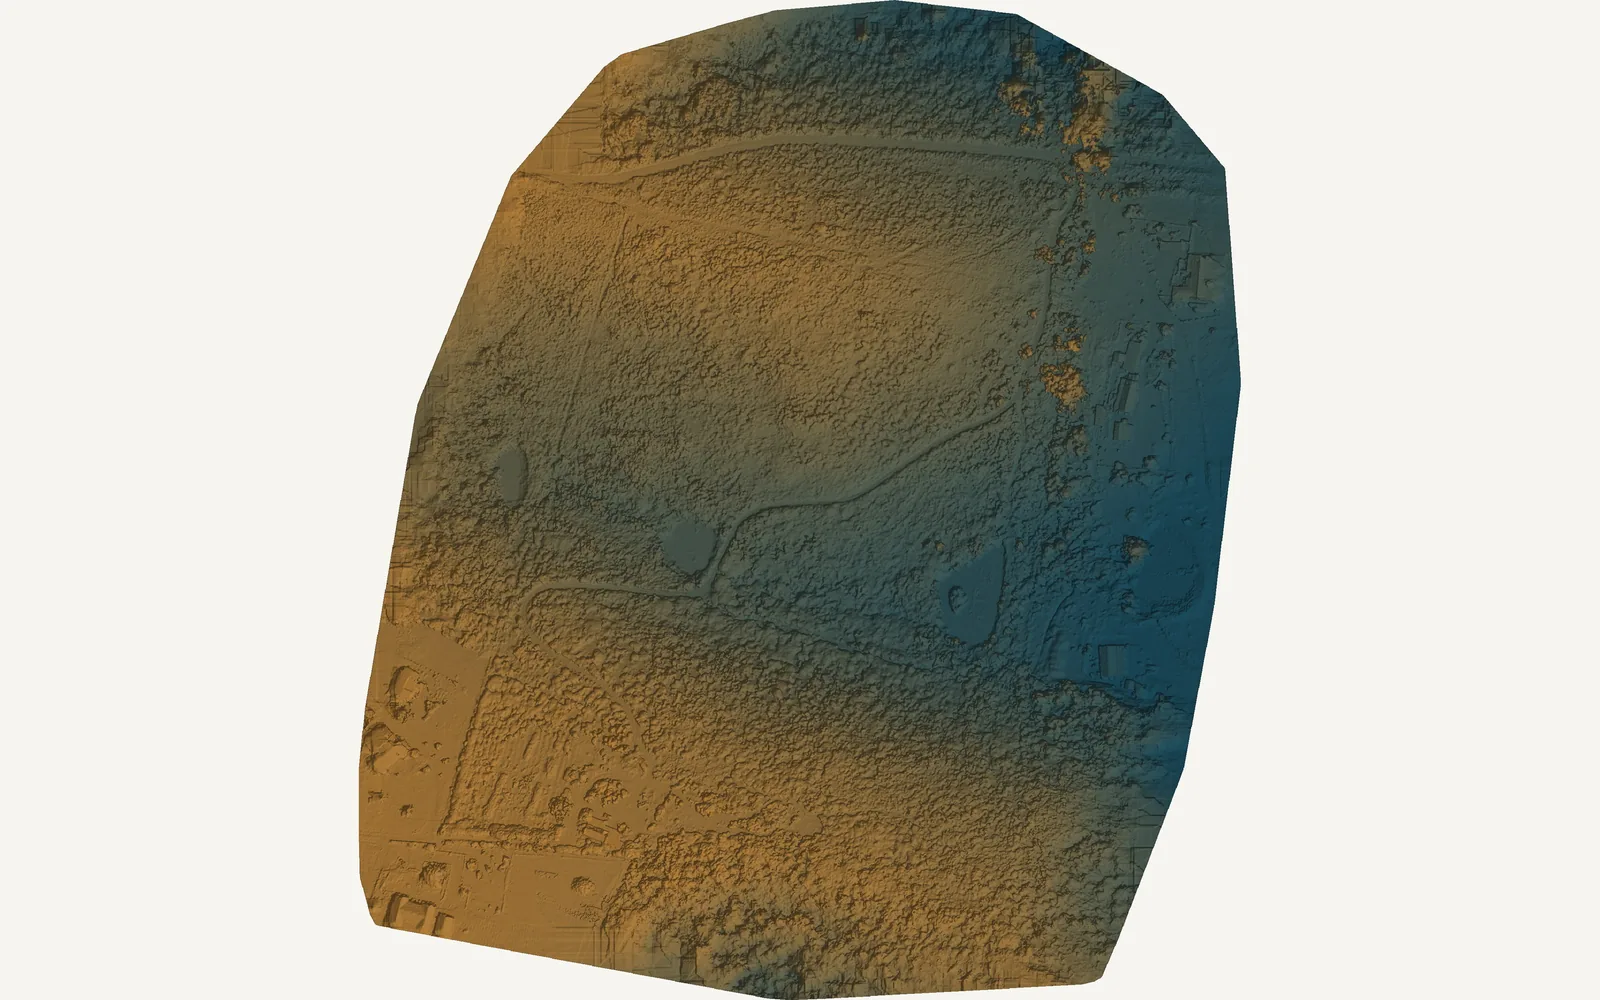
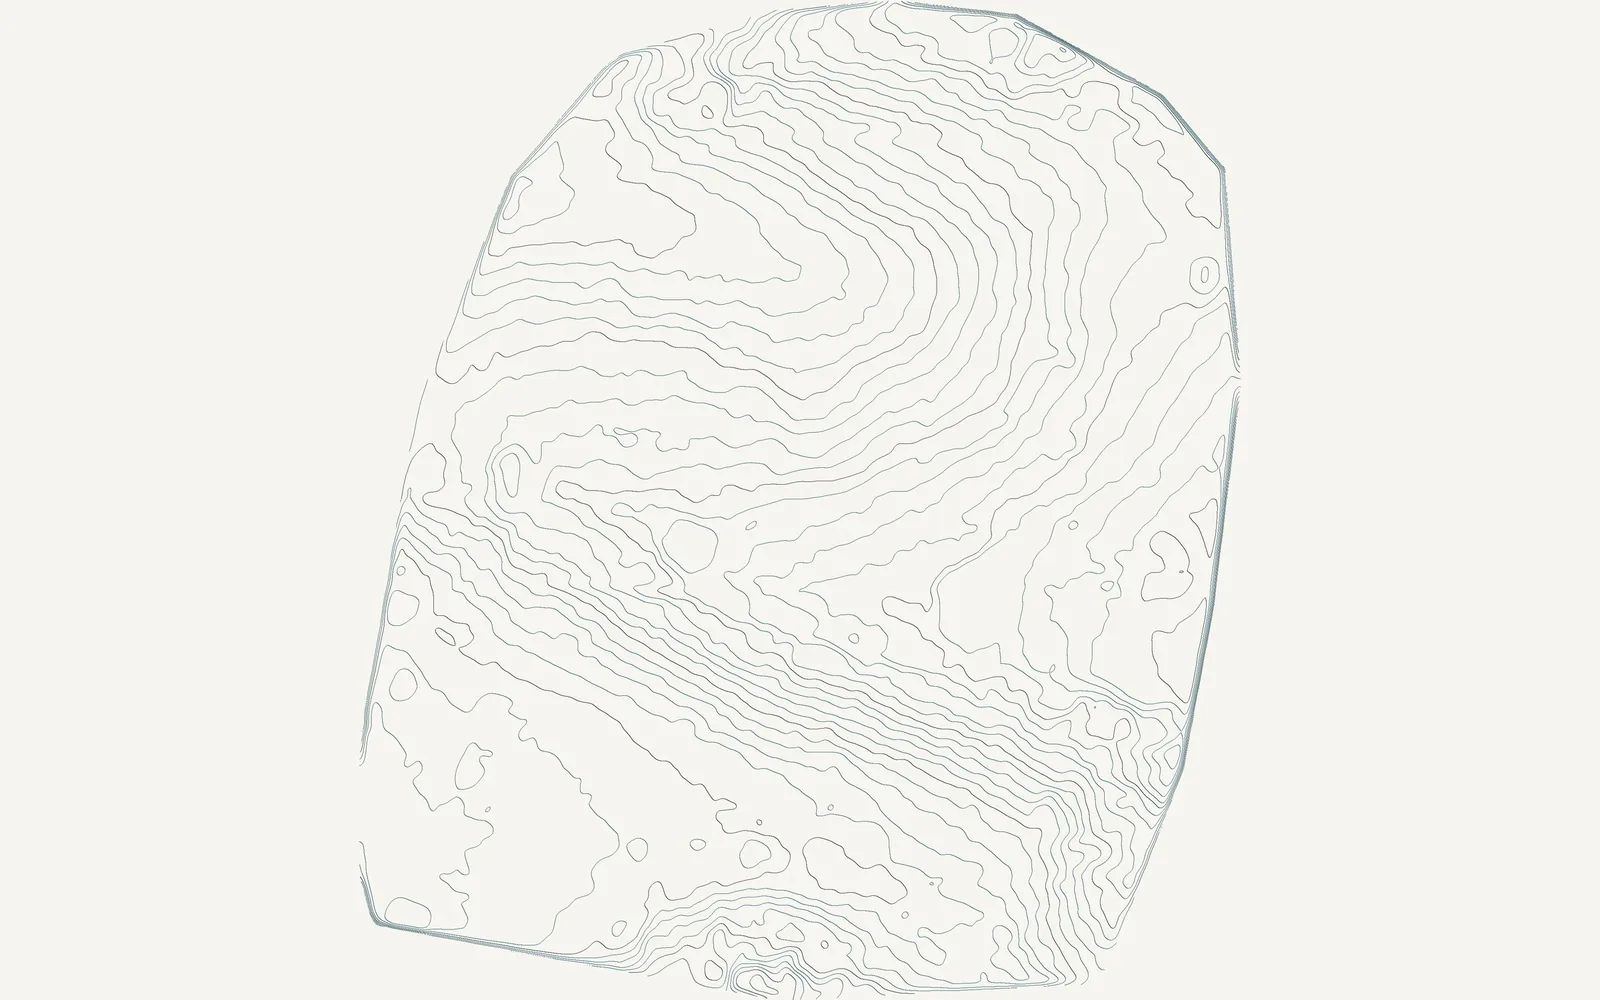
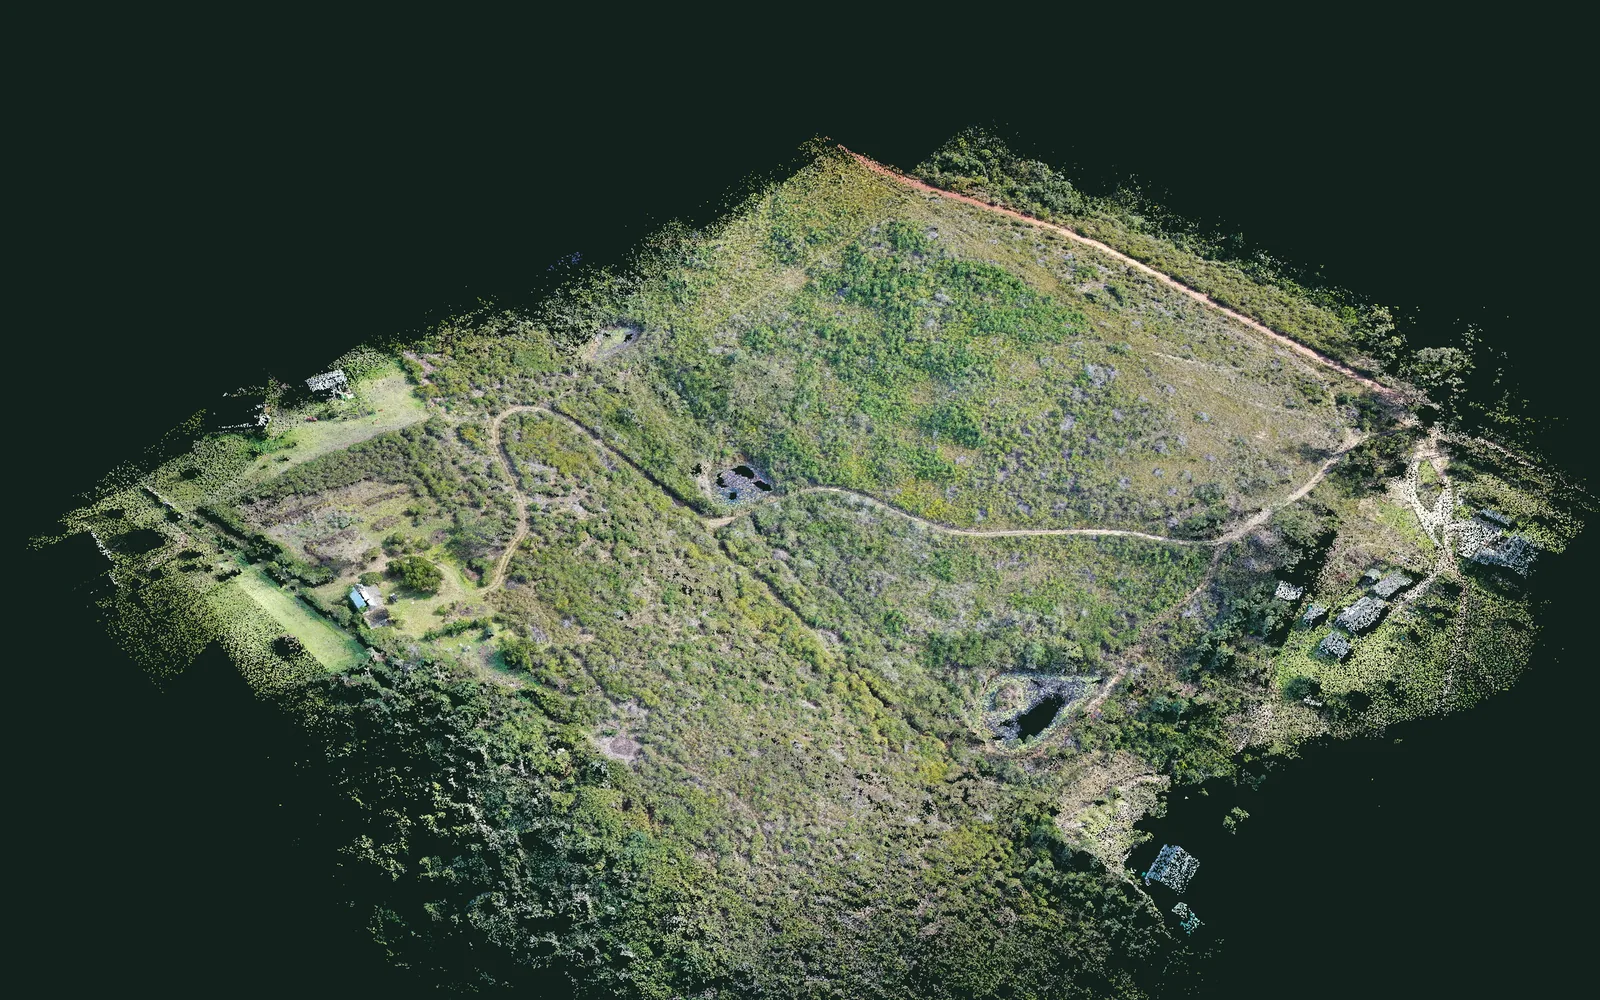
One survey is an example,
not a specification.
The 1.5 cm/px above comes from flying at 55 m with this camera. Fly higher and you cover more ground per battery and resolve less; fly lower and the reverse. What your site needs depends on its size, its terrain and what you want to do with the result, which is why there is no single number on the rest of this site either. What accuracy depends on sets that out properly.
This survey was flown for the landowner. It is shown here as an example of the work with their agreement, and it is not a claim about anyone's property but their own. Certified measurement remains a job for an appropriately qualified professional.
Left out of the map. Kept as photographs.
Flown low and close, these are useless to a reconstruction and among the best pictures of the property. You receive both.
Your property, the same way.
One flight, and you have the map, the model and the photographs. They are yours to keep.